If something that is quantifiable has changed, how much has it really changed?
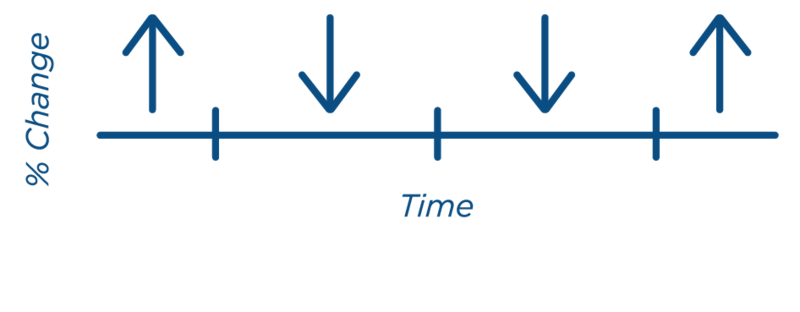
Oftentimes, changes for something being measured are explained in terms of a percent change. Percent changes indicate the relative variation of a specific quantity over intervals of time.
Consider annual installations of industrial robots globally between 2020 and 2021. Growth in robot installations was approximately 31% higher in 2021 compared to the prior pandemic year. This interpretation of change is calculated with respect to an original value or base value.
What if there was interest in gauging industrial robot penetration in general manufacturing in the United States? One approach to quantify this might be to assess the potential growth in robot installations with respect to robot density.
Robot density measures the number of operational industrial robots for every 10,000 employees. In 2021 for example, robot density for the United States within general manufacturing (excluding the automotive industry) was approximately 60% above the total global robot density for industrial robots in this space. However, robot density in general manufacturing was significantly lower than its counterpart, automotive.
This is a scenario where a mathematical model may help answer how much a quantity changes with respect to some other quantity. A derivative is a rate that allows this type of change to be captured. The premise of the derivative is that as changes occur to an input variable (in this case, robot density) over smaller intervals, the resulting impact these changes have on the output variable (in this case, robot installation growth) can be estimated.
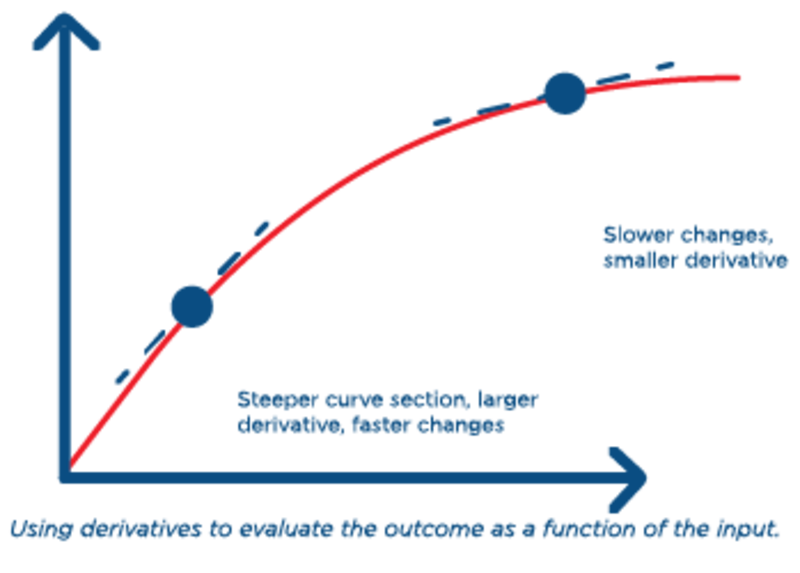
Another way to understand this is that the derivative helps expose how the total change is affected when the input variable itself changes.
Is robot density more influenced by specific robot technology trends or economic size?
In real-world applications, there is usually more than a single input variable. How are changes measured when there is greater dimensionality to the data? And what if the inputs each vary in multiple ways?
Gradients integral to machine learning applications are related to derivatives and allow changes to be measured when multiple inputs change in more than one direction. Gradients quantify the direction and magnitude of the total change otherwise identified simplistically as the steepest increase or decrease.
Gradients at a given point are evaluated based on the direction of steepest ascent. This direction signifies where a function increases the most relative to that point. This means that to find the largest change, the model moves toward the direction of the gradient.
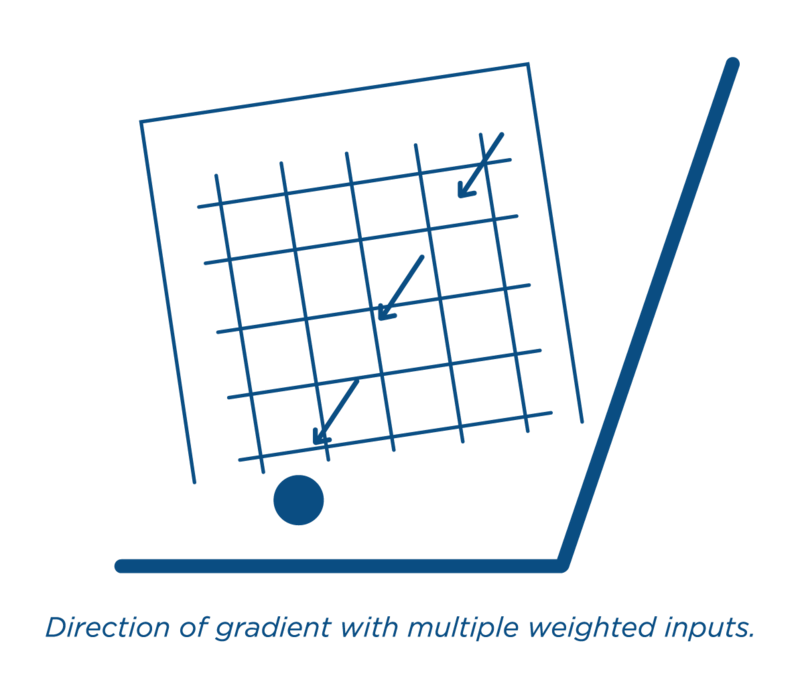
What role do growth rates play regarding derivatives? While growth rates are related to derivatives, their function and interpretation are different. Growth rates express average change usually as a percentage and convey how much something has changed over time. Examples of this include calculating yearly or daily changes. Derivatives reveal information about particular points in time rather than the collective.
How are derivatives and gradients beneficial?
Derivatives are the basis for finding inflection points. These points are measurements which indicate precisely where a relationship changes. Knowing this information helps identify subsets of data where the variation can be quantitatively compared.
Derivatives and gradients allow change to be understood in greater depth. They can yield maximums and minimums of inputs which confirm regions in the data where the complexities of these relationships can be further realized, albeit not entirely.
Note:
Partial derivatives have been excluded from this article.
Source:
Müller, Christopher: World Robotics 2022 – Industrial Robots, IFR Statistical Department, VDMA Services GmbH, Frankfurt am Main, Germany, 2022.


