The last 21 months have seen the most active investment period on record for additive manufacturing (AM) companies. The investment announcements, when taken in aggregate, reflect the collective entrepreneurial effort in each technology category as well as the interest level from financial and corporate strategic investors. Reviewing these data highlighted numerous growth trends in AM across four broad subcategories.
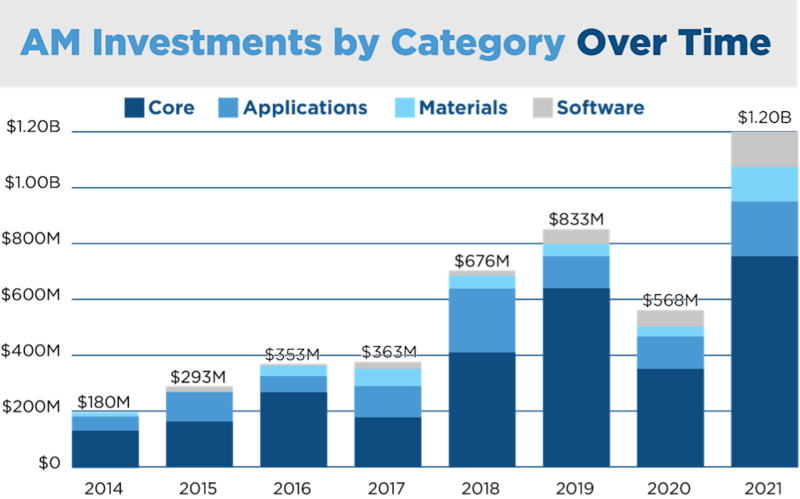
Caption: Core investments represent AM processes, 3D printers, and post-processing equipment developers alongside printing service providers, online marketplaces, and other hardware technology enablers. The software category represents companies with a specialization in additive manufacturing software across any part of the computer-aided design, engineering, or manufacturing workflow. Applications companies include specialized service companies focused on a particular industry or product class, such as heat exchangers, aerospace and defense, or medical implants. Lastly, materials investments cover materials suppliers, formulators, and developers.
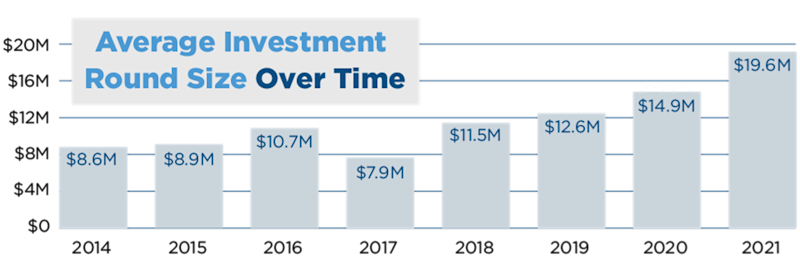
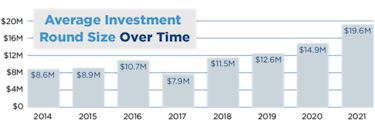
Global venture capital investment in additive manufacturing companies has grown 28% annually, from $353 million in 2016 to $1.2 billion in 2021. Any lost momentum from 2020 (down $265 million) was regained twice-over in 2021 (up $631 million). The pandemic-related delay in funding from 2020 added on to expected investment needs in 2021 and resulted in more than double the demand for VC funding. More impressive than the demand was how it was satisfied: Average deal size increased to a record high of $19 million. Larger investment rounds most likely represent a combination of increased valuations and the overall startup landscape growing up. Of the four categories – core, applications, materials, and software – the market share by software topped the growth rate, starting from a mere $3 million in 2016 to $125 million in 2021, while the other three have largely centered around the 28% CAGR. Despite software’s explosive growth, it was the smallest category in 2016 at $3.3 million and is now on par with applications and materials categories in 2021 at $128 million. Despite the materials, software, and applications categories collectively now making up 36% of investments ($437 million) in 2021, these areas are still underfunded relative to the core companies and this lack of funding continues to limit the broader adoption of AM.
Mergers and acquisitions (M&A) in AM have grown in number, from 17 events in 2017 to 29 in 2019, before dropping down to 2020’s respectable 25 events, despite the year’s disruptions. In the same way that investments were delayed due to widespread uncertainty, M&A events saw a record year in 2021, with 49 companies finding new ownership. The drivers here were not simply a result of delayed action in 2020; the pandemic pushed 3D printing back into the public spotlight and secondarily highlighted the larger, privately held 3D-printing companies as targets for listing publicly via special purpose acquisition companies (SPACs). At least $1.2 billion in AM investments in 2021 argue that a new baseline for growth has been established, with the implications of these investments taking years to show in broader market sizes.
This article and corresponding data collection and analysis was completed by Dayton Horvath. For questions or comments, please email dhorvath@AMTonline.org.


